Beyond the Numbers: How to Use Financial Ratios to Detect Early Warning Signs of Business Failure
Signals That Most Businesses Miss
Corporate failure is almost never a sudden event. Months — and often years — before a business collapses, the warning signals are visible in its financial data. Margins compressing quietly year after year. Liquidity ratios drifting downward across consecutive reporting periods. Debt levels climbing faster than revenue. These patterns do not announce themselves loudly; they accumulate gradually, buried in the numbers that most creditors and commercial partners never examine closely enough.
The discipline of using Financial Ratios as an early warning system transforms this hidden data into actionable intelligence. For credit managers, lenders, investors, and business owners evaluating their own performance, this capability is not a sophisticated analytical luxury — it is a foundational risk management skill with direct and material impact on financial outcomes.
Why Trend Analysis Is More Valuable Than Snapshots
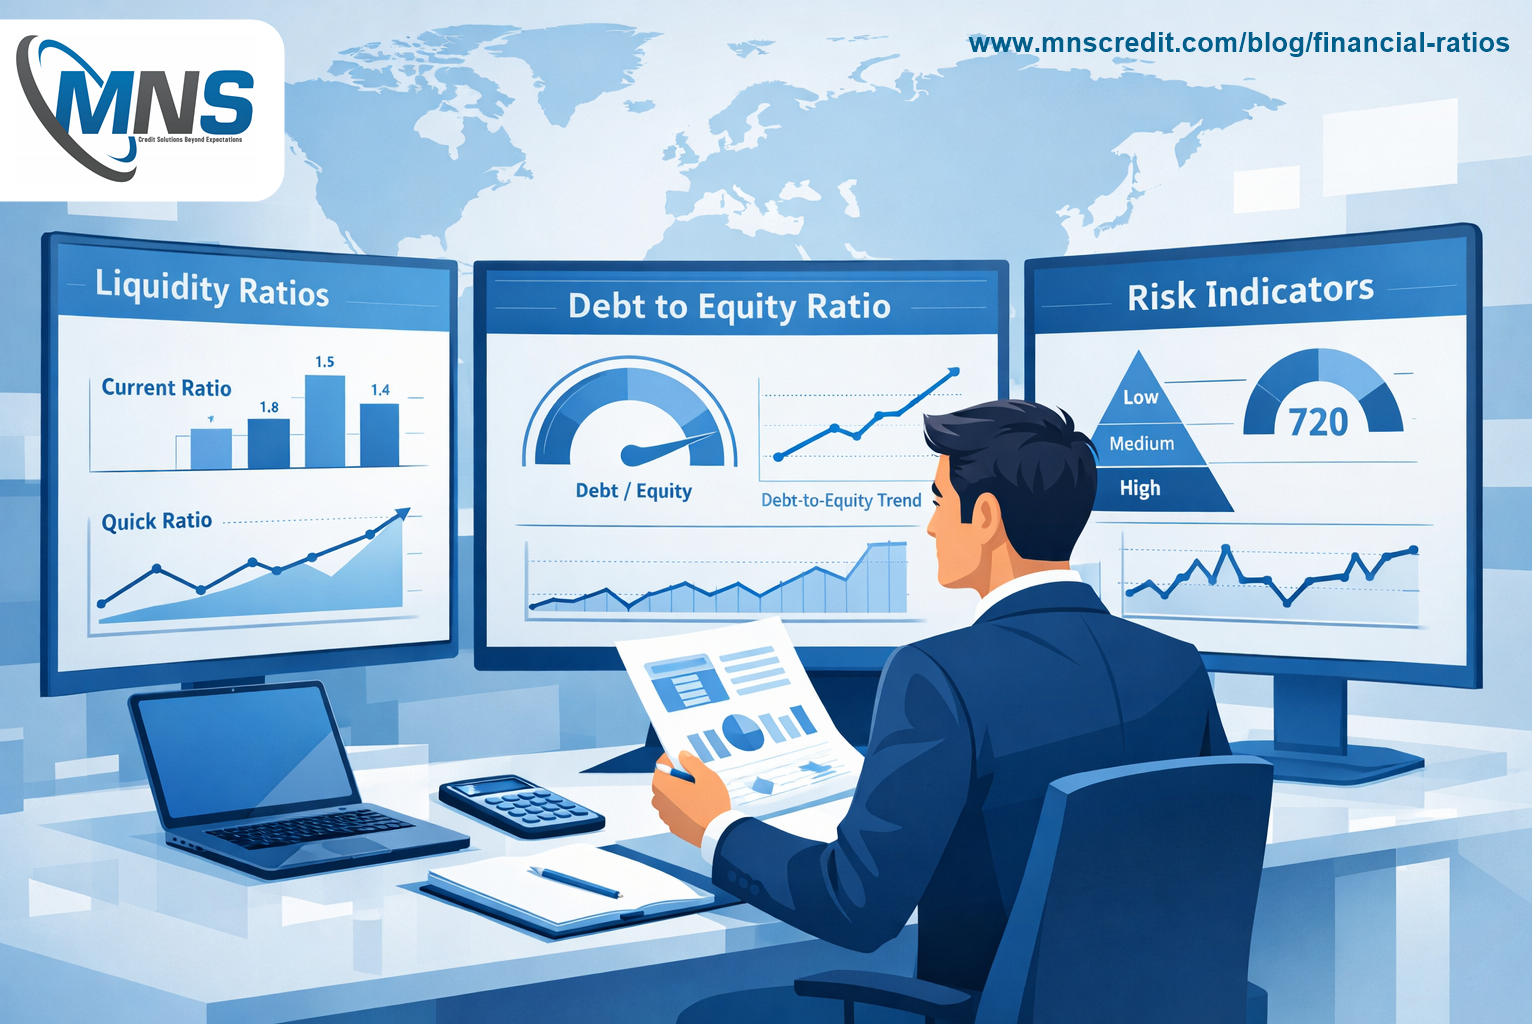
The most common mistake in ratio-based risk assessment is treating a single year's figures as definitive. A Current Ratio of 1.4 in isolation says little. A Current Ratio that has moved from 2.8 to 2.1 to 1.4 over three consecutive years says a great deal — it describes a company whose liquidity is deteriorating consistently, and whose trajectory, if unchanged, leads toward genuine payment difficulty.
Trend analysis — tracking key Financial Ratios across a minimum of three years, and ideally five — transforms static snapshots into a moving picture of financial health. The direction of travel is frequently more informative than the absolute value of any individual ratio, particularly in the early stages of deterioration when figures may still appear acceptable by conventional benchmarks.
Liquidity Ratios: The First Line of Warning
Liquidity ratios are among the earliest and most sensitive indicators of approaching financial distress. The Current Ratio, which compares current assets to current liabilities, measures a company's ability to meet its short-term obligations from its near-term resources. A steady decline in this ratio — even if it has not yet fallen below the conventional 1.0 threshold — signals progressive tightening of financial flexibility.
The Quick Ratio adds greater precision by excluding inventory, which may be slow to convert to cash. When the gap between the Current Ratio and the Quick Ratio widens over time, the company is increasingly reliant on inventory liquidity — a more fragile position that warrants closer attention, particularly in industries where inventory carrying costs are high or demand is variable.
Interest Coverage: A Sensitive Distress Barometer
The Interest Coverage Ratio — operating profit divided by interest expense — is one of the most reliable leading indicators of debt-related distress. When this ratio falls below 3.0, the company has limited headroom to absorb revenue disruption while continuing to service its debt. Below 2.0, the warning is urgent. Below 1.5, the company is likely in genuine difficulty, with earnings barely sufficient to cover financing costs before any operational investment is considered.
A falling Interest Coverage Ratio across consecutive years is a compound signal: it tells you simultaneously that earnings are under pressure and that debt costs are consuming an increasing share of those earnings. Both dimensions of this deterioration are important, and each reinforces the risk message of the other.
Margin Compression as a Long-Lead Indicator
Profit margin compression — the gradual erosion of gross or net profit margins over multiple reporting periods — is one of the longest-lead indicators of eventual business failure. A company experiencing consistent margin compression is losing its economic efficiency, whether through rising input costs, competitive pricing pressure, poor overhead management, or a deteriorating product or service mix. Left uncorrected, this trajectory ultimately produces losses and, with them, the cash flow deterioration that precedes default.
The critical analytical skill is recognising margin compression early — when it is still modest and potentially reversible — rather than after it has advanced to the point where it is driving operating losses. A Business Information Report that presents multi-year financial data in a structured format makes this trend identification significantly faster and more reliable than reviewing raw financial statements independently.
Leverage Trends and the Debt Accumulation Warning
A rising Debt-to-Equity Ratio across consecutive years signals that a company is progressively increasing its financial leverage — borrowing more relative to its equity base. Moderate leverage is normal and often healthy; leverage that is increasing consistently without a corresponding improvement in earnings quality or asset productivity is a warning of growing financial fragility.
The key question when evaluating leverage trends is whether the debt being accumulated is generating proportionate returns. A rising D/E ratio accompanied by strong revenue growth and improving margins is very different from one accompanied by stagnant or declining operational performance. Context matters — but the trend itself always warrants investigation.
Combining Ratio Signals: The Composite Risk Picture
The most powerful early warning assessments do not rely on any single ratio in isolation — they identify convergence between multiple deteriorating signals. A company where liquidity is declining, margins are compressing, interest coverage is falling, and leverage is rising simultaneously is in significantly more distress than one where only one of these trends is visible. Composite deterioration across multiple ratio categories is the pattern most closely associated with eventual default.
For creditors and commercial partners seeking a comprehensive, structured view of these patterns, a well-constructed Business Information Report — one that presents key Financial Ratios across multiple years alongside payment behaviour and compliance data — provides the analytical foundation that effective early warning requires.
Conclusion
Business failure leaves footprints long before it arrives. Financial Ratios, read as trends rather than snapshots and interpreted in combination rather than isolation, reveal those footprints with remarkable consistency. Businesses and credit professionals that invest in developing this early warning capability protect themselves from the most avoidable category of financial loss — the default that the data predicted, if only someone had been watching closely enough.